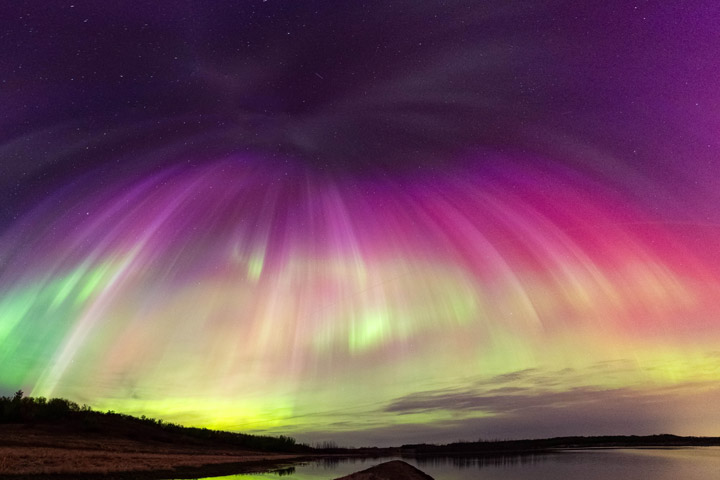
Space scientists and sky-watchers were treated to a stunning display of the northern lights in May 2024.
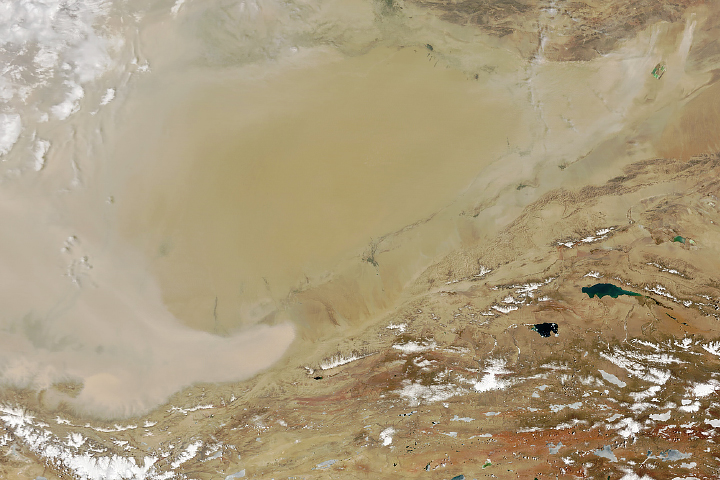
Strong winds kicked up sand and dust from China’s vast Taklimakan Desert.
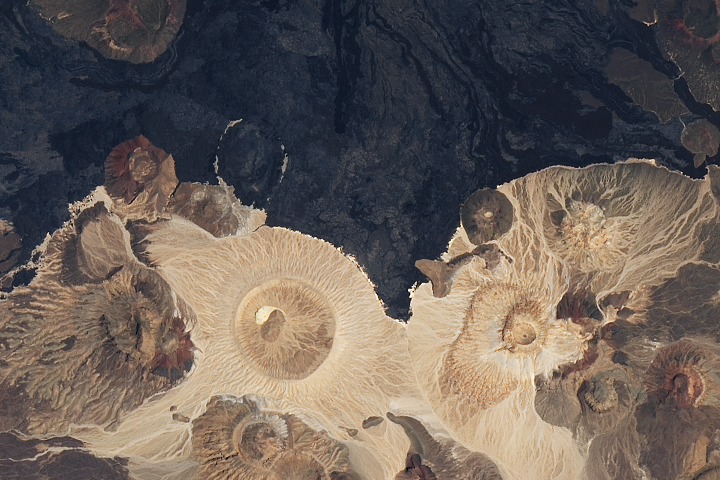
Contrasting colors of lava and ash reveal the geologic origins of Harrat Khaybar’s volcanic cones.
Published May 22, 2024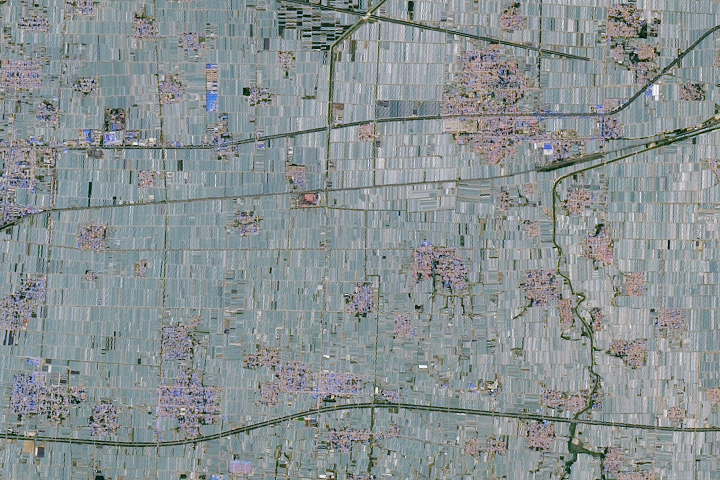
Your challenge is to tell us the location of the satellite image and why it is interesting.
Published May 21, 2024
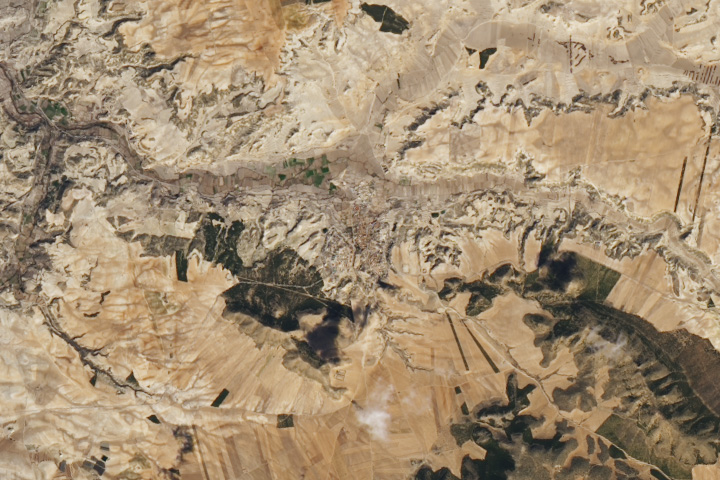
Ancient hominin fossils lie beneath the sandy soils on the outskirts of this village in southern Spain.
Published May 20, 2024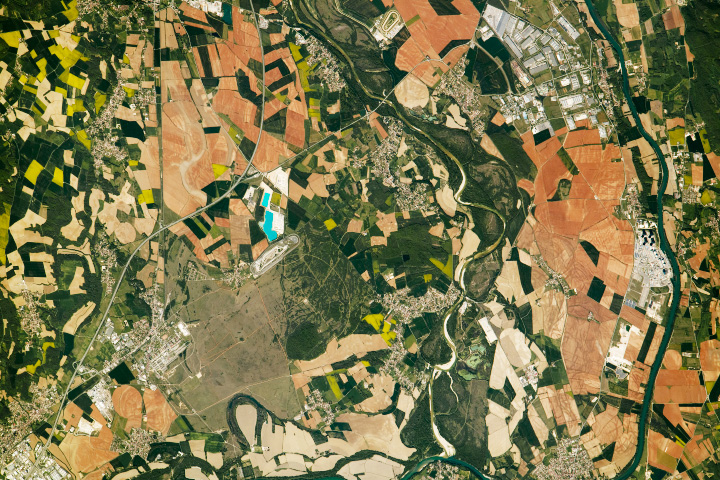
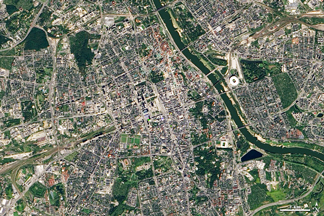
Farmers grow a variety of crops along river floodplains near Lyon.
Published May 19, 2024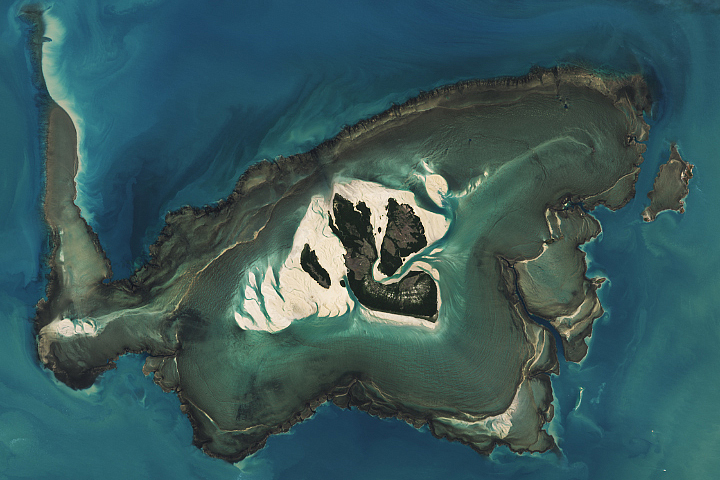
Large tidal swings expose a plateau-shaped reef around Australia’s Yawajaba island at low tide.
Published May 18, 2024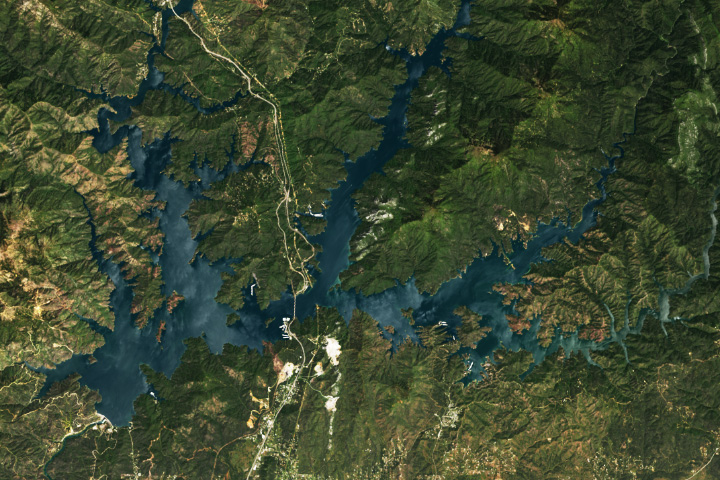
For the second year in a row, California’s largest reservoir filled to nearly 100 percent capacity.
Published May 17, 2024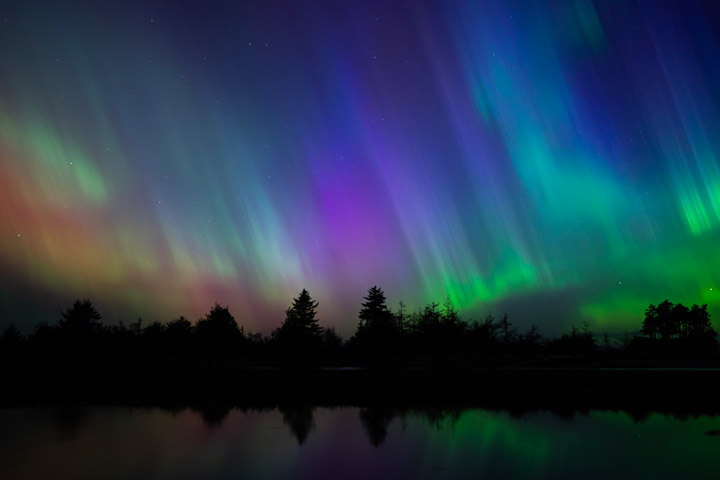
Participants in NASA's Aurorasaurus project captured these images during the May 2024 geomagnetic storm.
Published May 15, 2024
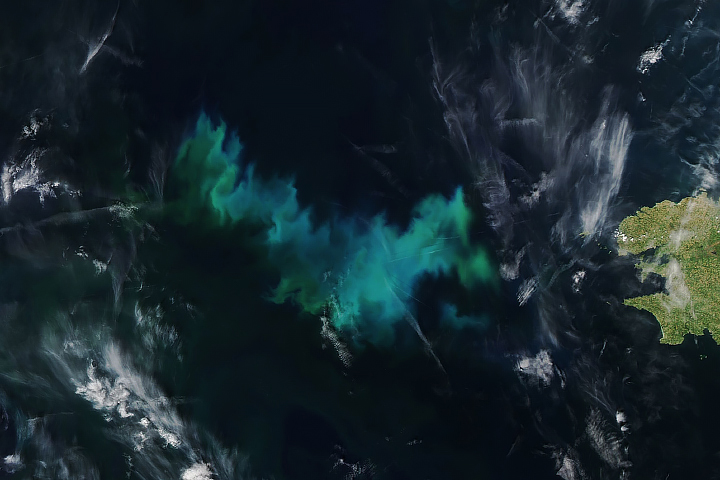
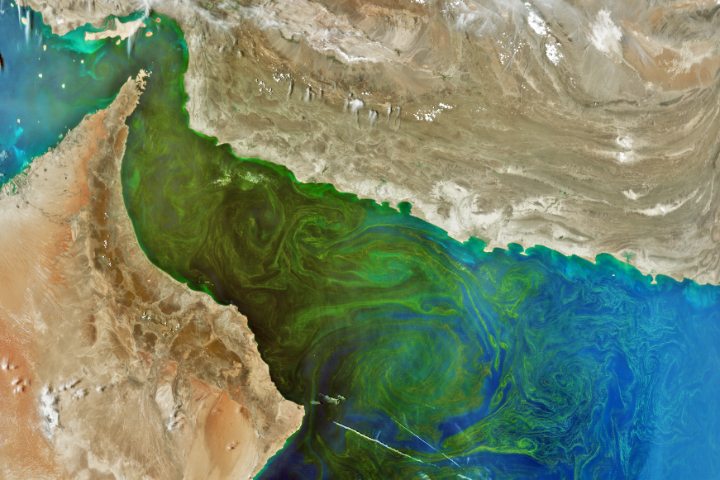
Satellites captured an expansive blue and green phytoplankton bloom in the waters off France.
Published May 14, 2024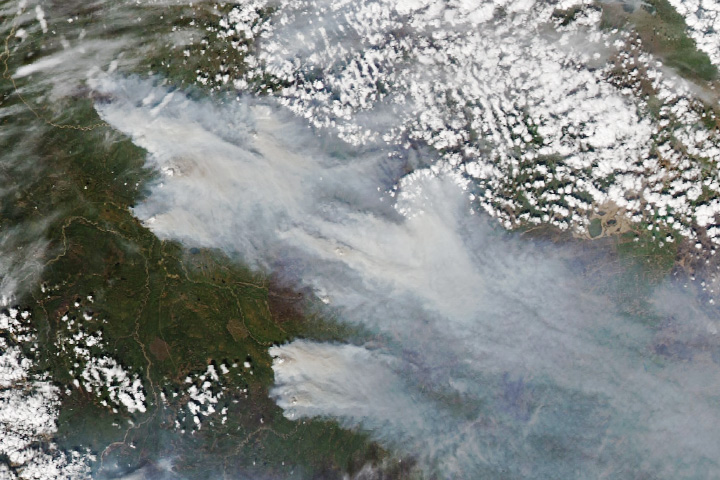
Unusually early and intense fires are spreading rapidly amid drought and high winds.
Published May 13, 2024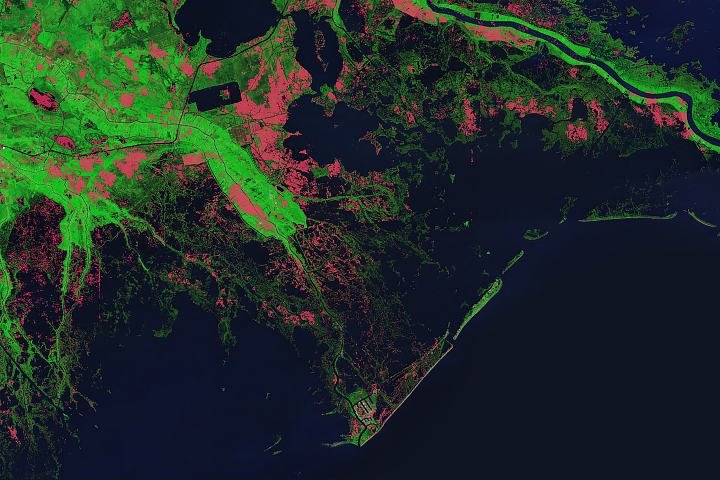
Scientists have been tracking how strong storms have eaten into the Gulf state’s coastline.
Published May 13, 2024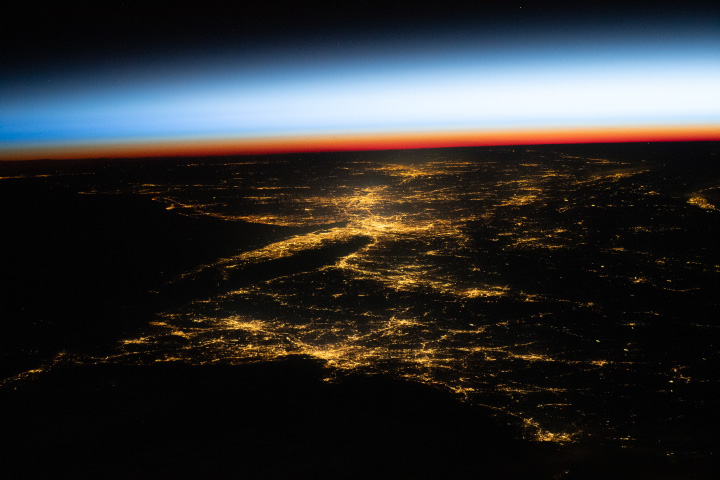
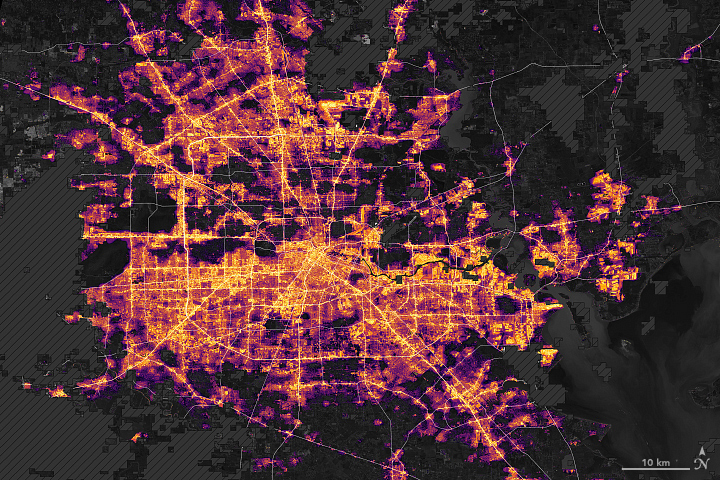
As sunlight waned, the glow of artificial light revealed patterns of urbanization along the populous corridor.
Published May 12, 2024Have you ever wondered what it would be like to live in a different part of the world? What would the weather be like? What kinds of animals would you see? Which plants live there? By investigating these questions, you are learning about biomes.
Published Aug 28, 2020
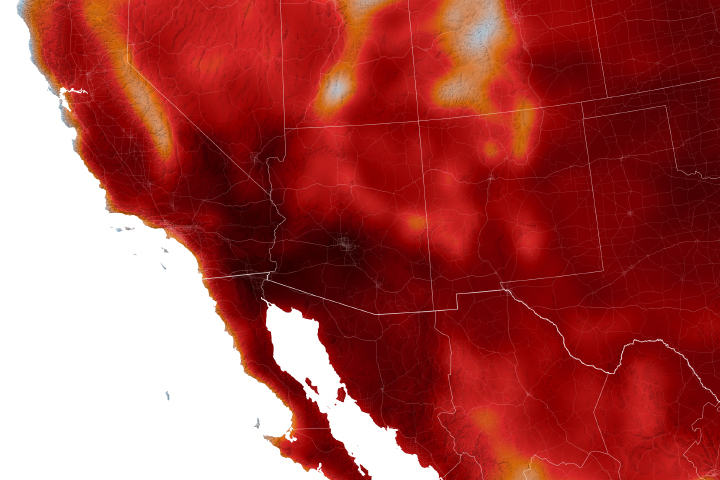
Land surface temperatures rise and fall with the heat of the Sun, and they represent how hot or cold the surface would feel to touch. These maps show daytime land temperatures as measured from space.
What do you do when presented with a new satellite image? Here's what the Earth Observatory team does to understand the view.
Published Nov 18, 2013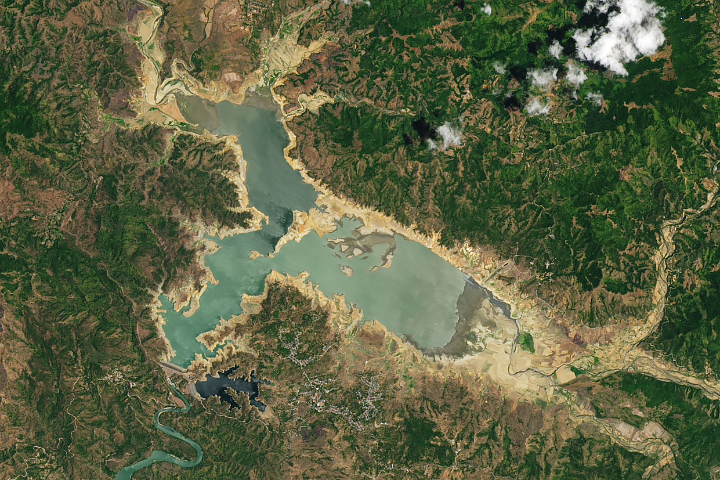
Searing temperatures and little rain reduced water levels of Pantabangan Lake, one of the country’s largest reservoirs.
Published May 11, 2024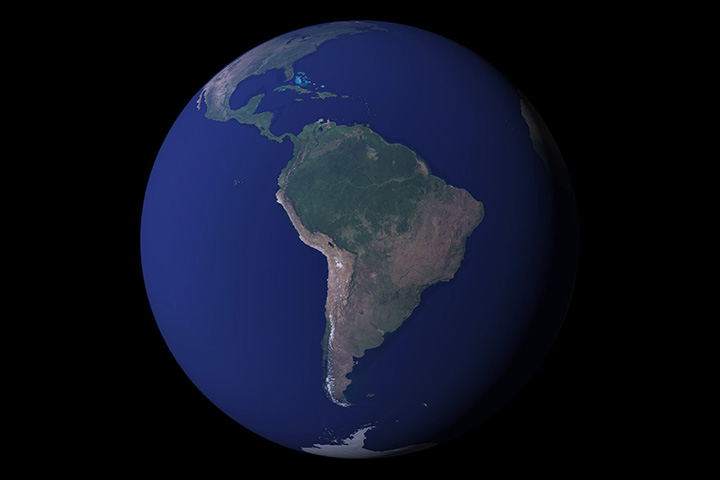
12 months of high-resolution global true color satellite imagery.
Published Oct 13, 2005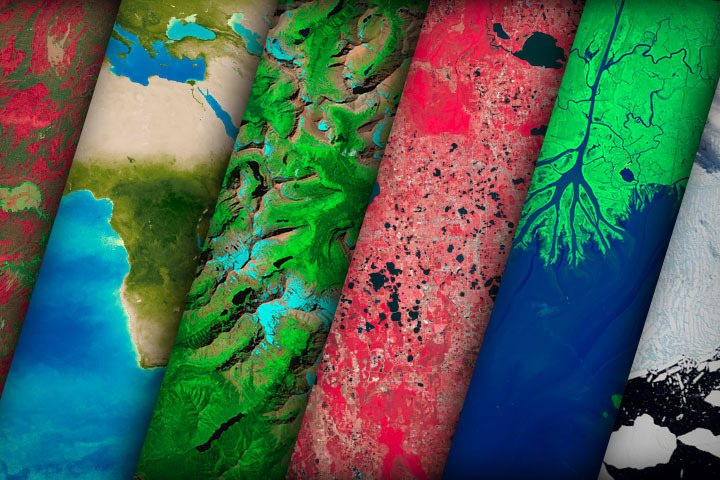
NASA satellites document how our world—forests, oceans, human landscapes, even the Sun—changes over months, seasons, and years.
Published Apr 29, 2009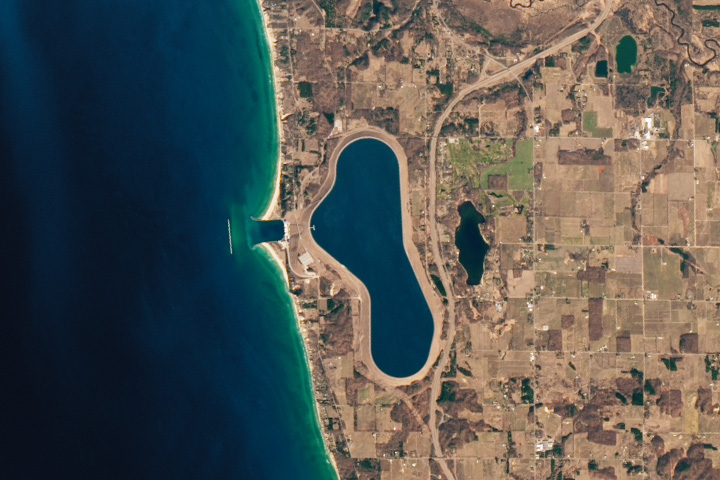
Michigan’s Ludington Pumped Storage Plant uses excess electricity to pump water uphill, which generates power when it flows back down.
Published May 10, 2024
These maps depict monthly total rainfall around the world. Rainfall is the primary source of fresh water for humans, plants, and animals. Rain also moves heat between the atmosphere, oceans, and land.
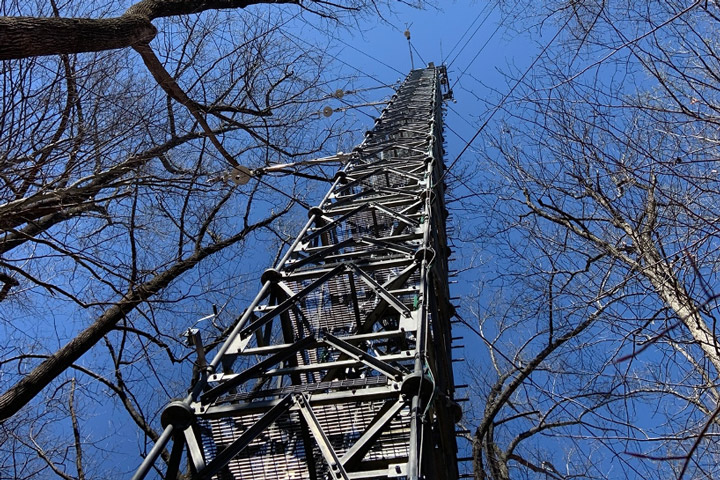
Using instruments old and new, scientists collected data as leaves emerged across a deciduous forest in Edgewater, Maryland.
Published May 6, 2024

Ocean temperatures can influence weather, such as hurricane formation, and climate patterns, such as El Niño. These maps show the temperature at the surface of the world’s seas and oceans.
Your challenge is to tell us the location of the satellite image and why it is interesting.
Published Apr 23, 2024
Warmer-than-average temperatures are showing up locally and globally, with consequences for people, landscapes, and ecosystems.
Published Aug 15, 2023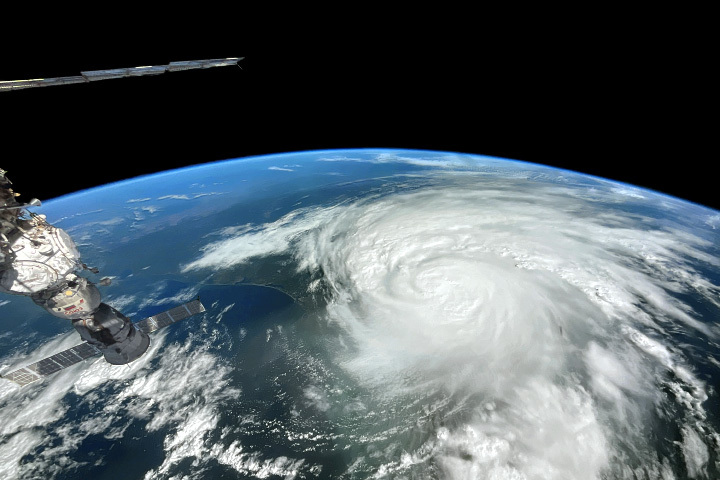
The 2023 season runs from June 1 to November 30, with peak activity generally occurring in September.
Published Jun 1, 2023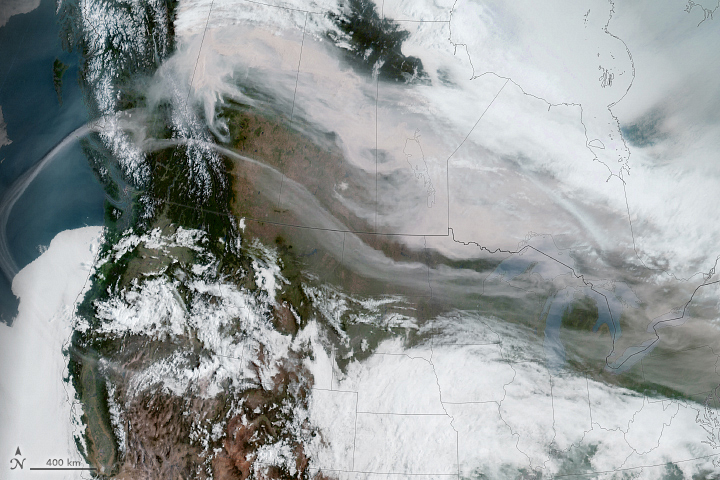
Wildland fires in 2023 brought hazy skies and poor air quality to several countries north of the equator.
Published May 22, 2023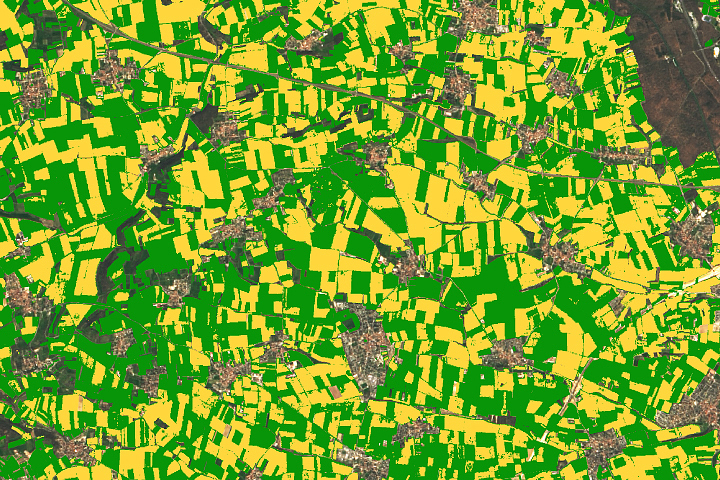
From soil conditions to crop productivity, satellite data help inform farmers, scientists, and decision-makers in the U.S. and around the world.
Published Feb 28, 2023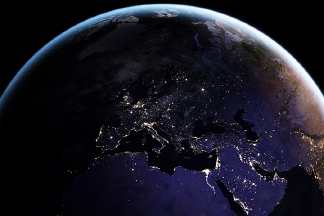
Satellite images of Earth at night have been a curiosity for the public and a tool of fundamental research for at least 25 years. They have provided a broad, beautiful picture, showing how humans have shaped the planet and lit up the darkness.
Published Apr 12, 2017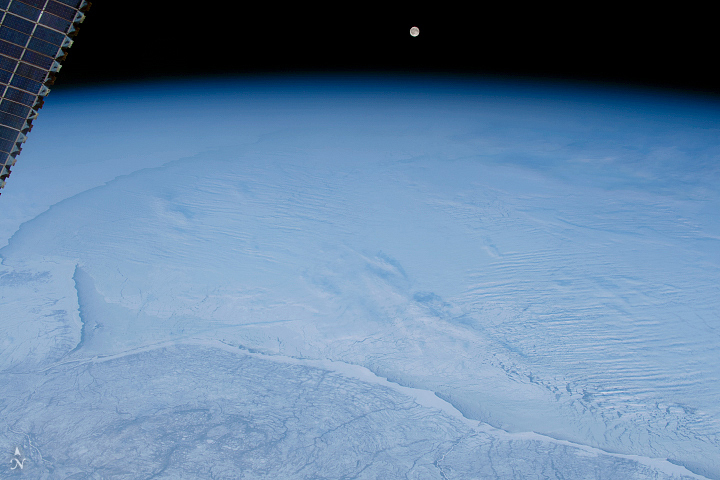
Over the years, astronauts aboard the orbiting laboratory have snapped spectacular photographs of Earth’s snow and ice in both hemispheres.
Published Dec 21, 2022
Airborne aerosols can cause or prevent cloud formation and harm human health. These maps depict aerosol concentrations in the air based on how the tiny particles reflect or absorb visible and infrared light.
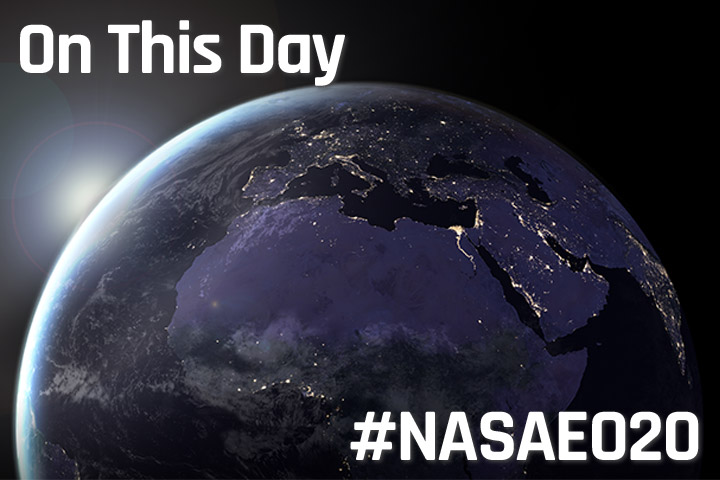
In honor of our site anniversary, we offer a selection of some of the most beautiful, newsworthy, interesting, and scientifically important images from 23 years online — one image for each day of the calendar year.
Published Apr 26, 2022
In addition to making rain and snow, clouds can have a warming or cooling influence depending on their altitude, type, and when they form. These maps show what fraction of an area was cloudy each month.

These maps show the average amount of water vapor in a column of atmosphere by month. Water vapor is the key precursor for rain and snow and one of the most important greenhouse gases in the atmosphere.